Summary
Numerical modelling is a powerful tool that is well suited for examining the role played by cultured bivalves in coastal ecosystems. However, the massive amounts of input data required to run the models and the complexity of the analyses, particularly with respect to ecosystem modelling, often dissuade stakeholders from embracing modelling in their decision making process. Here we present a simpler method based exclusively on hydrodynamic modelling. Results are used to describe the transport of a tracer mimicking shellfish food (i.e., phytoplankton), with its own rate of production and rate of removal by the cultured shellfish. We applied this diagnostic method in a coastal embayment to demonstrate its suitability for spatial planning processes.
Introduction
Shellfish aquaculture may raise spatial planning issues because it occurs in coastal areas, often within bays already utilized for diverse human activities. Its development may also raise concerns about an over-utilizationof natural resources, namely the phytoplankton on which the cultured shellfish grow. The usual methodology put in place to address this type of carrying capacity issues is based on a numerical modelling framework that captures the complexity of interactions between the cultured species and the environment. However, most of these numerical tools are research-orientedand need large datasets and a high computational power to be implemented. Therefore, there is a requirement for a parallel development of simpler tools that could address industry and management questions.
The present contribution describes a numerical modelling tool aimed at producing valuable information in the context of marine spatial planning and coastal resource management at a relatively low cost in terms of data collection as it solely involves hydrodynamic modelling. A case study is provided for Tracadie Bay, Prince Edward Island, Canada.
Material and Methods
A common step to most carrying capacity studies is the hydrodynamic modelling of the receiving embayment system. This step constitutes the basis of the diagnostic method presented here. Any numerical hydrodynamic model with an advection-dispersionscheme may be used. For the purpose of the present investigation, the finite element model RMA-10 was used to reproduce the water circulation driven by tides and river discharges. Results were validated against in situ data of water levels and currents recorded in different locations inside the coastal system.
The advection-dispersionscheme was first used to simulate the transport of a passive tracer and estimate the spatial distribution of the water renewal time over the entire system. This simulation alone generates useful information in the context of spatial planning.
Theadvection-dispersionscheme was applied a second time to reproduce the dynamics of a non- passive tracer representing phytoplankton, the main food source for cultured bivalves. This step was achieved following the equation:
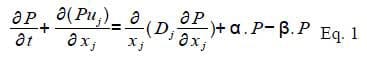
where P is the phytoplankton concentration, uj is the local current velocity in direction xj calculated by the hydrodynamic model, Dj is the dispersion coefficient proportional to uj, α is the phytoplankton turn-over rate (expressed in number of times per day), which was estimated from primary production measurements, and β is the bivalve population clearance rate (expressed in number of times per day the entire bay volume is pumped through the bivalves). β was calculated as the product of individual bivalve clearance rate (m3/d) and density of bivalves in the farm area (ind/m2) and divided by depth. This last term of the equation is only included in the active farm areas of the model domain.
We propose to run this type of simulation for a period equal or longer than the longest water renewal time estimated in the system. This will ensure that the whole system has gone at least once through a complete hydrodynamic renewal. The phytoplankton concentration is then averaged over the last tidal cycle of the period. The mean concentration calculated at each node of the model domain may be compared to the initial concentration (set uniform over the system and equal to the constant open boundary value) to estimate the net accretion/depletion resulting from the transport, production and consumption of the phytoplankton.
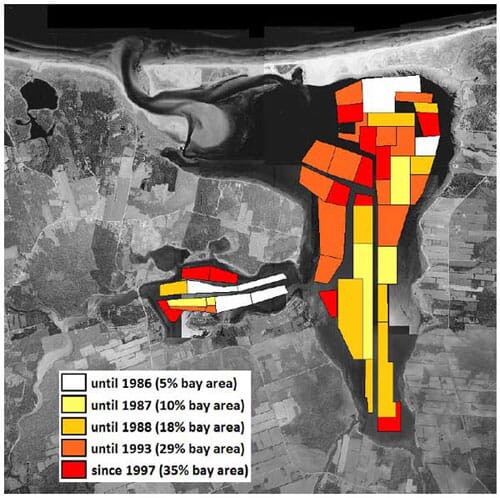
The above diagnostic method was applied to Tracadie Bay, a coastal embayment on the northern shore of Prince Edward Island, intensively used for blue mussel (Mytilus edulis) long line culture. The development of mussel culture in Tracadie Bay started in the early 80's. Our modelling procedure was repeated for five distinct phases of development, which corresponded to years 1986, 1987, 1988, 1993, and 1997 (representing current conditions). Each phase differs only by the areal coverage of farms in the Bay (Fig. 2a). Parameter β in Eq. 1 was estimated from mussel clearance rate data and husbandry practices specific to Tracadie Bay, resulting in β = 2.02 d-1for a farm having a water depth of 5 m. Since no primary production data was available for this particular location, a value of 0.25 d-1, which is in the range of reported values for temperate regions, was given to the parameter α.
Results
Water renewal time
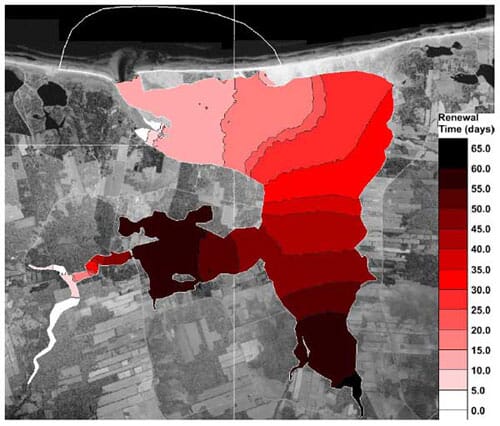
The spatial distribution of water renewal time shown on Fig. 1 is typical of coastal embayments with a decreasing gradient of tidal flushing from the inlet to the head of the bay. The influence of river discharge may be seen in the western arm, where renewal times are reduced to values comparable to the ones estimated in the vicinity of the inlet. Except for these two peripheral areas, water renewal is rather slow, with renewal times exceeding 25 days over most of the inner bay.
Phytoplankton depletion
Depletion estimates for the five stages of aquaculture development in Tracadie Bay were compiled as depletion footprint curves in Fig. 2b. These curves relate the relative depletion ( per cent reduction in phytoplankton concentration compared to initial/boundary conditions) to the fraction of the Bay where this level of depletion occurs. The theoretical curve defined by Gibbs is reproduced for reference as it represents the expected shape of a depletion pattern, i.e. high depletion over a restricted portion of the bay surrounding the farm and decreasing depletion intensity as a larger fraction of the bay is considered. However, the position of the curve relative to the axes must be adjusted for any given situation as it depends on the hydrodynamics of the system and on management criteria.
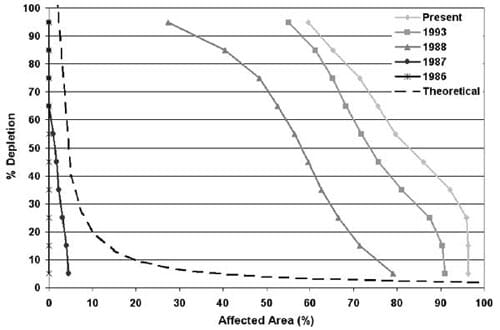
Up until 1987, when farms were covering 10 per cent of the bay, the predicted depletion footprints follow a pattern similar to the theoretical shape. Conversely, the next three situations depart quite strongly from the expected footprint. The first unusual feature is found in the area of strong depletion where the curve is not as steep as the theoretical footprint, showing that a high level of depletion may develop over a rather large portion of the bay. At the other end of the footprint a sharp increase in depletion intensity may be seen. This second feature indicates that the outer part of the bay that benefits from the strongest tidal flushing (Fig. 1) and the absence of mussel farms is somewhat isolated from the rest of the bay, with low depletion being confined to this part of the system. Finally, the middle part of the curve is also very steep showing that virtually no buffer or dilution zone exists in the inner bay. This region exhibits high levels of depletion due to the combination of a slow water renewal and a high biomass of cultured mussels. Overall, these results suggest that the relevant spatial scale on which to base any management decision in Tracadie Bay corresponds to the whole inner bay, which covers 60 to 80 per cent of the entire embayment.
Discussion/Conclusions
A diagnostic method based only on hydrodynamic modelling andadvection-dispersionof a numerical tracer was developed to quantify the effects of cultured shellfish on their main food source in coastal regions.
This procedure integrates the same parameters and time scales found in the classic Dame index, i.e. water renewal time, phytoplanktonturn-over time and bivalve clearance time. However, the present diagnostic benefits from a spatially detailed and dynamic framework that integrates the main physical and biological processes driving the evolution of phytoplankton concentration.
The methodology is sensitive to two parameters, α and β. Hence, care is warranted when collecting data for these coefficients, which on the other hand are often readily available in major shellfish cultivation areas.
The main advantage of the procedure is the production of depletion footprint curves, which are valuable for coastal zone management and spatial planning. The procedure may be viewed as an intermediate tool, well above the Dame Index but not as sophisticated as elaborated numerical models. In cases where the procedure detects an issue, and further investigation is warranted, thealready-developedhydrodynamic models would be implemented into more detailed ecological numerical models.
November 2013