Introduction
With an average annual growth rate of 8.8 per cent over the last 30 years, aquaculture is the world’s fastest growing agro-food sector. Mean annual global fish consumption climbed from 16 kg per capita in 2000 to a record high of 18.6 kg per capita in 2010, as a result of this rapid expansion (FAO, 2012). By 2018, half the fish used for direct human consumption will be farmed (FAO, 2012) and by 2022, aquaculture is forecast to provide an additional 22 million tons of fish; an increase of 35 per cent over current levels (OECD-FAO, 2013). In contrast, the total output of global capture fisheries has remained static for 20 years, and 80 per cent of fish stocks for which data are available are exploited at or beyond sustainable levels (Muir, 2013). A fundamental transition in the structure of the global fisheries sector, from supply dominated by capture fisheries to supply dominated by aquaculture, is taking place (Belton & Thilsted, 2014). This trend is apparent in Bangladesh where, following three decades of sustained growth, aquaculture now accounts for 53 per cent of reported fish production (DOF, 2013).
Bangladesh’s wider economy is also undergoing a structural transition (Zhang et al., 2013). Annual GDP growth averaging nearly 6 per cent throughout the decade 2000–10 caused poverty to decline by 1.7 per cent per year, from 49 per cent to 31.5 per cent (BBS, 2011). The number of poor fell from 63 million to 47 million during this period. The depth of poverty (the poverty gap index) was also reduced by nearly half, allowing Bangladesh to attain this Millennium Development Goal target five years earlier than expected (World Bank, 2013). Growth was pro-poor from 2005 to 2010, with households below the 70th percentile of the per capita consumption distribution experiencing the largest relative increases in per capita consumption (World Bank, 2013). These improvements occurred in spite of food price shocks in 2007–08.
Although aquaculture is widely held to contribute to both poverty reduction and food security (Belton & Little, 2011) evidence for this is patchy (Arthur, Béné, Leschen, & Little, 2013), there have been few specific studies of how increases in farmed fish availability affect access and use by poor consumers (Beveridge, Thilsted, Phillips, Metian, Troell, & Hall, 2013), and the effects of the structural transition in fisheries on low-income consumers are poorly understood (Allison, 2011). This is apparent in Bangladesh, where it has been argued that the food and nutrition security implications of the on-going substitution between wild and cultured fish are ambiguous (Belton, van Assledonk, & Thilsted, 2014), and the capacity of aquaculture to meet the consumption needs of poor consumers has long been questioned (Lewis, 1997).
To investigate this dynamic further, this paper analyses whether changes in fish consumption in Bangladesh linked to the growth of aquaculture have been pro-poor, using fish consumption data collected by the Bangladesh Bureau of Statistics for its Household Income and Expenditure Survey (HIES) in 2000, 2005, and 2010. This analysis, which contributes to debates in Bangladesh and more widely on whether the effects of aquaculture’s growth have been pro-poor, is unique in utilizing a nationally representative dataset for this purpose, and in drawing explicit links between the outcomes of aquaculture growth and wider changes in a national economy.
The article is organized as follows: First, we summarize debates over the relationship between aquaculture and poverty, provide contextual information on poverty and fisheries in Bangladesh, and define the term "pro-poor." Second, we determine the proportions of fish consumption originating from capture fisheries and aquaculture, and categorize households as "extreme poor," "moderate poor," or "non-poor" according to national poverty lines. Third, we summarize trends in poverty, and identify poverty differentiated changes in the consumption and price of fish from aquaculture and capture fisheries in rural and urban areas from 2000 to 2010. We conclude by summarizing the implications of these findings for poverty and food security and find that, although aquaculture growth was pro-poor, this outcome was partly contingent on favorable changes occurring in the wider economy.
Aquaculture and poverty
The fisheries sector in Bangladesh
Bangladesh’s fisheries sector (capture fisheries and aquaculture combined) contributed 4.4 per cent of national gross domestic product (GDP) and 25 per cent of agricultural GDP in 2012 (MOF, 2012), with a total output of 3.26 million tons (DOF, 2013). The value of Bangladesh’s aquaculture products alone amounted to $3.37 billion in 2011 (FAO, 2013). Production originates from three main sub-sectors: inland capture fisheries, marine capture fisheries, and aquaculture, the respective shares of which are 29 per cent, 18 per cent, and 53 per cent (DOF, 2013). The term "inland capture fishery" refers to the harvesting of self-reproducing fish and prawn populations from open inland water bodies (Ali, 1989). Capture fisheries in Bangladesh are generally characterized by labor intensive small-scale activities, organized at household or community level (Islam & Chuenpagdee, 2013). Seasonal fishing in flooded areas is an important component of marginal and landless household’s livelihoods (Lewis, 1997), with more than 70 per cent of rural households reported to participate in fishing for subsistence, income, or both (Halls et al., 2008, Shankar et al., 2004 and Thompson et al., 2002). Marine capture fisheries are also largely artisanal (Islam, 2003). Pond-based aquaculture producing fin-fish for domestic markets is practiced throughout the country. More than 4 million households engage in "quasi-peasant" forms of production which usually constitute a minor component of diverse agrarian livelihood portfolios, but smaller numbers of more productive "quasi-capitalist" and capitalist producers contribute over two thirds of aquaculture’s total output (Belton & Azad, 2012).1
Although the rapid growth of these latter forms of production has resulted in large increases in the aggregate volumes of fish produced, much of their areal expansion has taken place through the enclosure and conversion of seasonal floodplains which formerly supported common access fisheries during the monsoon. These changes have resulted in reductions of wild fish biodiversity and biomass, as well as exclusion of poor fishers from access to them (Sultana, 2012). The intensification of agriculture, water control initiatives, road building, urban encroachment, pollution, and increasing fishing effort have also been responsible for major declines in the productivity of inland capture fisheries (Ali, 1997, Belton et al., 2011, Halls et al., 2008, Lewis, 1997 and Sultana, 2012).
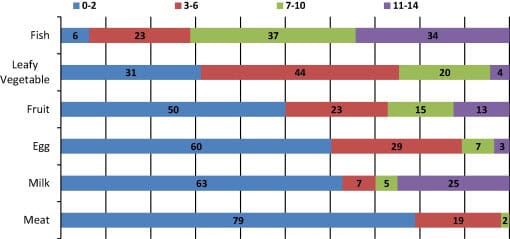
Bangladesh performs poorly on a range of indicators of food and nutrition security (HKI, 2011), and malnutrition is estimated to cost the country $1 billion per year in terms of economic productivity forgone (Howlader, Kavita, Ferdousi, Dipika, Sommerfelt, & Tara, 2012). In this context, changes affecting supply and consumption of fish, whether positive or negative, can have major public health implications. Fisheries are the most important supplier of high quality protein, essential fatty acids, and micronutrients in Bangladesh (Roos, Wahab, Chamnan, & Thilsted, 2007). Fish accounts for the second highest share of food expenditures after rice (Minten et al., 2010), and is the most frequently consumed animal-source food across all social strata, as well as the most frequently consumed nutrient rich food (Figure 1). In addition to providing micronutrients which are difficult to obtain from plant-based foods in adequate quantities (Murphy & Allen, 2003), consumption of fish and other animal-source foods increases the bioavailability and absorption of nutrients from plant-based components of the diet (Neumann, Harris, & Rogers, 2001). The very high frequency of fish consumption in Bangladesh, as compared to intakes of all other animal-source foods, makes this dietary function "irreplaceable" (Kent, 1987). Given this context, in the following analysis we consider increases in individual consumption of fish to be de facto positive as, unlike many other foods, there are very few negative effects associated with high levels of consumption ( Tacon & Metian, 2013).
Aquaculture—poverty linkages
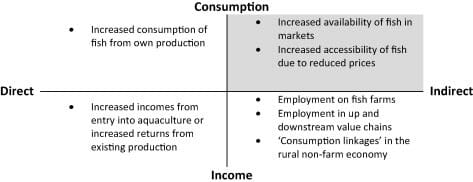
Aquaculture has attracted considerable interest as a vehicle for reducing poverty and food insecurity, and a variety of pathways via which the poor might gain from the growth of aquaculture have been identified (Figure 2). Kassam (2013) has also elaborated a similar typology of aquaculture’s potential to impact poverty, drawing on the work of de Janvry and Sadoulet (2002) on direct and indirect agriculture–poverty linkages. The main potential benefits stem from improved food supply and/or increased incomes and employment. Benefits may be accessed directly (i.e., by a producer of farmed aquatic products), or indirectly (e.g., through employment in aquaculture value chains, or through increased availability of low-cost fish in local markets) (Edwards, 1999). Ahmed and Lorica (2002) emphasize "income linkages," "employment linkages" and "[food] consumption linkages" as means by which aquaculture can improve food security and reduce poverty. Again, these may be direct (e.g., sale and consumption of self-produced fish by farm households), or indirect (e.g., elasticity effects associated with rising incomes for households adopting aquaculture, or reduced consumer prices due to increased fish supply). Similarly, Stevenson and Irz (2009) identify entry into aquaculture by new producers, employment on fish farms and in associated value chains, and increased supply of fish for consumption by the poor as pathways via which aquaculture may contribute to poverty reduction. A final indirect pathway relates to "consumption linkages" generated by re-spending income from sales of farmed fish on locally produced "non-tradable" goods and services (Delgado et al., 2003, Kassam, 2013 and Stanley, 2003).
Ten multi- and bi-lateral donors invested $275 million in 24 aquaculture and capture fisheries projects in Bangladesh during 1990–2003 (Karim, 1998), and numerous additional large sectoral investments have been made since this time. Development interventions such as these have typically promoted "small-scale" forms of aquaculture, and emphasized direct income and consumption effects on poverty reduction (Belton & Little, 2011). Studies which have systematically attempted ex-post impact assessment of such projects have identified broadly positive, if rather modest, effects on household incomes, farm output, and food security (Hallman et al., 2003, Jahan et al., 2010, Rand and Tarp, 2010 and Thompson et al., 2006). Lewis (1997) and Belton, Haque, and Little (2012) have both argued however, that the ability of the poorest to gain from this type of aquaculture is constrained in Bangladesh due to extremely high levels of landlessness.
Research exploring the relationship between private-sector-driven commercial aquaculture and poverty has tended to focus on indirect contributions to poverty reduction, with access to benefits by the poor conceptualized as deriving mainly from paid employment (Belton and Little, 2011, Beveridge et al., 2010 and Brummett et al., 2008). Belton et al. (2012) suggest that the development of commercial "quasi-capitalist" aquaculture in Bangladesh has enabled landless labor to access indirect flows of benefits through employment in ancillary services. Similarly, Toufique and Gregory (2008) report that poor and middle-income households in Bangladesh have gained indirectly from the development of commercial aquaculture via new employment opportunities, but that most direct benefits are captured by wealthy landowners. In the Philippines, based on a Gini decomposition, Irz, Stevenson, Tanoy, Villarante, and Morissens (2007) found that commercial shrimp aquaculture reduced economic inequality in several coastal villages, again primarily as a result of employment generation effects.
Although these studies are instructive, their reliability and generalizability is somewhat compromised because they are based on case studies and/or limited in geographical scope, and are designed with variable degrees of methodological rigor (Arthur et al., 2013). With two exceptions (Hallman et al., 2003 and Irz et al., 2007), the studies referred to above do not explicitly categorize households according to their poverty status, limiting their analytical precision, while the majority of the longitudinal analyses (Hallman et al., 2003, Rand and Tarp, 2010 and Thompson et al., 2006) compare data from two time periods only, and thereby fail to capture longer run trends.
Furthermore, no empirical study to date has addressed the indirect consumption pathway identified in the shaded upper right quadrant of Figure 2. This represents a major omission. We argue that since the capacity of the extreme poor to benefit directly from aquaculture is constrained by lack of assets, at least in Bangladesh, indirect linkages are likely to be more significant from a poverty reduction perspective. Although important, the employment opportunities associated with aquaculture are finite and tend to be geographically concentrated. It is through indirect food consumption linkages therefore, that aquaculture has the potential to impact the largest numbers of poor people. The "indirect consumption" linkage is the focus of our analysis for the remainder of this paper. Although we acknowledge the existence of local complexities and trade-offs in inter- and intra-household distributional impacts resulting from the on-going shift from capture to farmed fish production, our subsequent discussions of whether aquaculture is pro-poor relate principally to the "indirect consumption" relationship as expressed at the aggregate national level.
Dey, Bose, and Alam (2010) have shown that the income and price elasticity of fish in Bangladesh is greater for poor households than for better-off. This implies that a failure of production increases to keep pace with population growth and rising incomes will disproportionately negatively affect poorer sections of the population, if they result in higher fish prices. Conversely, the poor stand to benefit most from any decline in fish prices (in real terms) associated with increasing fish production (Dey et al., 2010). Although this insight possesses some explanatory power, it reveals nothing about actual material changes in consumption which have taken place in Bangladesh over the last decade. The present study is therefore unique in addressing whether the growth of aquaculture has been pro-poor in terms of food consumption effects, and in doing so on a nationally representative scale using multi-period data.
Defining pro-poor aquaculture growth
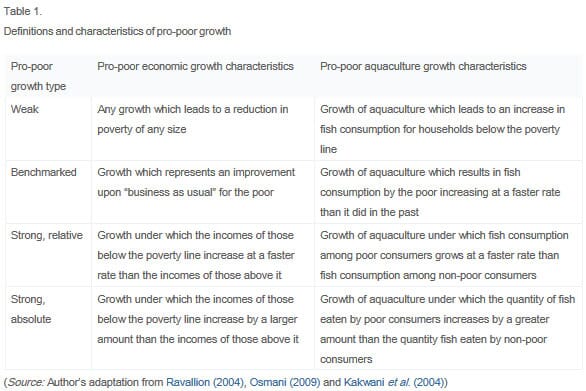
There are a number of interpretations of the term "pro-poor growth." Ravallion, 2004 and Ravallion, 2009 considers growth that reduces poverty by any amount to be pro-poor. Kakwani, Khandker, and Son (2004) label this definition "weak," on the basis that some degree of poverty reduction is characteristic of almost all growth processes. Furthermore, they argue that Ravallion’s definition fails to take into account the proportions in which benefits are distributed between the poor and non-poor, with the result that "a growth episode that gives every rich person $1 million and just 1 cent to a single poor person" could still be conceived of as pro-poor (Grinspun, 2009, p. 6). Kakwani et al. (2004) propose an alternative two-tiered "strong" definition. In this typology, only economic growth which benefits the poor proportionally more than the non-poor can be considered pro-poor. Strong pro-poor growth can be relative; where growth reduces poverty and relative inequality, or absolute; when the absolute benefits of growth received by the poor are equal to, or greater than, the absolute benefits received by the non-poor.
Osmani (2009) critiques both "weak" and "strong" approaches: the first, for similar reasons to Kakwani et al. (2004); the second, on the basis of its "potentially counterintuitive implications," which mean that a low growth rate which benefits the poor proportionately more than the rich would be characterized as pro-poor, while a high growth rate under which the poor benefitted proportionately less but which reduced poverty to a greater extent would not, "even though the poor have actually done better in the latter!" (Osmani, 2009, p9). An alternative approach is to consider any growth conditions under which the poor fare better than they did relative to some historical "benchmark," as pro-poor. In other words, in order for growth to be considered pro-poor "from the point of view of the poor, there must be an improvement over business as usual" (Osmani, 2009, p. 9). These definitions are summarized in Table 1, which also modifies them to fit the concept of "pro-poor aquaculture growth" in relation to the "indirect consumption" linkages set out in Figure 2. As each definition has certain advantages and disadvantages, rather than adopting a specific one, the following analysis evaluates how results correspond to each type of growth.
Poverty trends and fish consumption in Bangladesh
The following subsections present data on national poverty trends and changes in fish consumption (quantity and frequency) and fish prices over the period 2000–10. Analyses are differentiated by the poverty status (extreme, moderate, and non-poor) and geographical location (urban and rural) of consumers and by the sources of fish consumed (aquaculture, inland capture fisheries, etc.).
Poverty
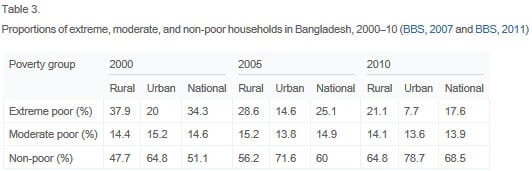
Bangladesh saw a dramatic reduction in the proportion of the population below the upper poverty line during 2000–10, from 48.9 per cent to 31.5 per cent (Table 3). Over this period, the extreme poor segment of the population (those living below the lower poverty line) shrunk from 34.3 per cent to 17.6 per cent, while the proportion of the population classed as moderate poor (those between the upper and lower poverty lines) remained almost constant at around 14 per cent. Rural areas lagged behind urban in terms of the proportion of the population classified as poor (35.2 per cent and 21.3 per cent respectively in 2010) (Table 3). However, the extreme poverty rate declined slightly faster in rural areas than in urban, and the average annual growth in real per capita consumption was twice as large in rural areas (2.1 per cent) relative to urban areas (0.9 per cent) throughout the decade (World Bank, 2013). Bangladesh experienced a modest decline in inequality at the national level over the course of the decade, as measured by the Gini index of real per capita consumption, and inequality in rural areas decreased from 2005 to 2010. As a result, Bangladesh’s growth over the entire period was characterized not only by rapid poverty reduction, but by a gradually narrowing gap between rural and urban areas and a stabilized level of inequality relative to other countries in the region (World Bank, 2013).
The majority of this overall decline in poverty is attributable to increasing rural wages. According to Hossain, Rahman, Nath, & Chowdhury (2013) real agricultural wages approximately doubled during 2000–10. Similarly, Zhang et al. (2013) report growth in real rural wages averaging approximately 10 per cent per annum from 2005 to 2010. They argue that this reflects a fundamental shift in the structure of the national economy, where "excess labor in rural areas becomes fully absorbed by the emerging nonfarm sector, initiating a rise in wages;" the "Lewis turning point" (Zhang et al., 2013, p. 2). These conclusions are broadly supported by World Bank (2013), which indicates that while total labor income from agriculture grew by only 1.7 per cent per year from 2000 to 2005, it grew 9.8 per cent per year during 2005–10. The same analysis suggests however that most of the rural income growth taking place in the second half of the decade came from the self-employed working on their own farms, while income growth among rural day laborers occurred at a more moderate rate (World Bank, 2013), although it should be noted that in practice most rural households engage in both self- and wage employment (Sen, 2003). Rather counter-intuitively, the World Bank attributes this change to the impact of the 2008 food price spike, stating that "higher commodity food prices permeated the economy by increasing the wages of agricultural workers" (World Bank, 2013, p. 27). Whatever the root causes of the increase in rural incomes from 2005 to 2010, the high income elasticity of demand for fish in Bangladesh (Dey et al., 2010) implies that these changes would be expected to have important implications for fish consumption.
Fish supply and consumption
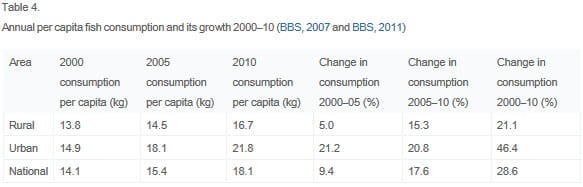
National average annual fish consumption per capita increased by more than 4 kg (29 per cent) from 14.1 kg in 2000 to 18.1 kg in 2010 (Table 4). Average annual rural and urban fish consumption per capita increased by 21 per cent and 46 per cent respectively during this period. This suggests that growth in national fish consumption and supply was fueled primarily by increasing demand for fish among urban households. However, whereas annual compound growth in urban fish consumption was steady at just over 4 per cent per annum from 2000 to 2010, average rural consumption growth increased sharply from 1 per cent per annum from 2000 to 2005 to just over 3 per cent from 2005 to 2010. This suggests that rising real wages and the faster rate of poverty reduction among rural households increased consumer spending power and resulted in a gradual narrowing of the urban/rural consumption gap. Thus, although growth in fish consumption was not pro-rural in either the "strong relative" or "strong absolute" sense, pro-rural consumption growth did occur during 2005–10, if the first half of the decade is considered as a benchmark (Osmani, 2009).
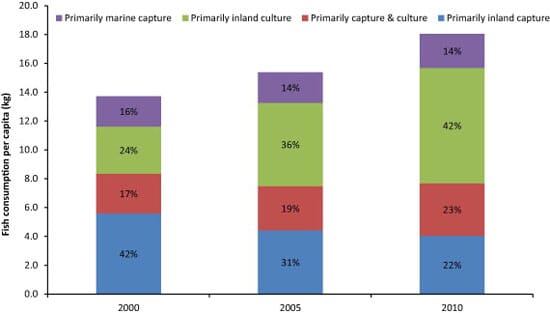
Narrowing of the rural/urban fish consumption gap and accompanying consumption growth occurred during a period when the proportionate and absolute contributions of inland capture fisheries to total fish production contracted sharply (Figure 3). During 2000–10, the share of fish originating primarily from inland capture fisheries fell from 42 per cent to 22 per cent of total consumption (a decline of 1.9 kg per capita). This pattern was reversed for fish from aquaculture, the share of which rose from 24 per cent to 42 per cent of total consumption (an increase of 4.3 kg per capita). The share of consumption of fish originating from the mixed category "inland capture and aquaculture" grew marginally, from 17 per cent to 23 per cent, representing an increase in consumption of 1.7 kg per capita. Given the trends described above, it is highly probable that this latter increase resulted from expanded aquaculture production, both masking and contributing to, a decline in production of inland capture fish. On this basis, it can be assumed that aquaculture’s contribution to total fish consumption stood at more than 50 per cent in 2010.
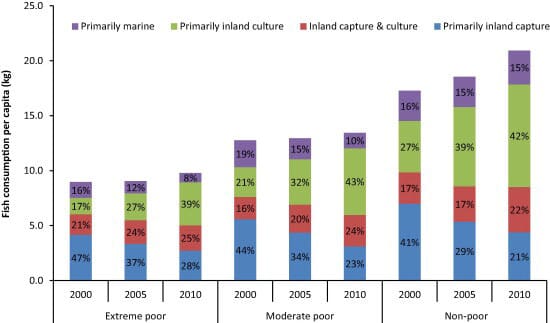
Similar patterns are apparent when consumption data are disaggregated by poverty group. Consumption of farmed fish increased and consumption of inland capture fish declined across all poverty groups from 2000 to 2010 (Figure 4). In 2000 and 2005, the majority of fish consumed by extreme and moderate poor households originated from inland capture fisheries. By 2010, the majority came from aquaculture. Poorer consumers were most heavily dependent on fish from inland capture fisheries in all years. Extreme poor households consumed proportionately more non-farmed fish than moderate poor households, and moderate poor households consumed proportionately more than non-poor. This reflects, in part, a correlation between poverty and self-provisioning of wild fish, as noted in Section 2. Extreme poor consumers obtained 24 per cent of the fish they consumed from non-market sources (primarily subsistence capture) in 2000. This fell to 15 per cent in 2010. Non-poor consumers obtained 18 per cent of fish from non-market sources in 2000, down to 10 per cent in 2010. This is indicative of declining access to inland fisheries resources which has engendered greater dependence on the market, and negatively affected poor consumers to a proportionately greater degree than non-poor.
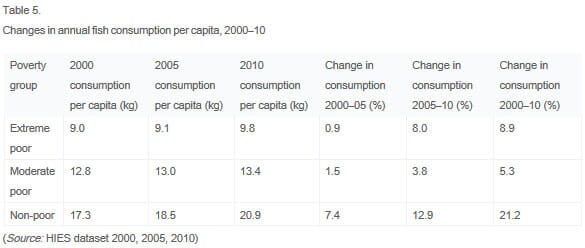
Data on annual fish consumption per capita by poverty group is presented in Table 5. Total fish consumption by extreme poor and moderate poor households remained more or less constant from 2000 to 2005, at around 9 kg and 13 kg per capita, respectively. Non-poor households registered a consumption increase of 1.2 kg per capita over this period. Thus, although the expansion of aquaculture during 2000–05 was sufficient to avert a decline in fish consumption among poor households, it was not large enough to bring about a substantial increase in their overall fish intake. This changed during 2005–10. Total fish consumption grew 0.7 kg (8 per cent) for extreme poor households and 0.5 kg (4 per cent) for the moderate poor. Non-poor households again benefited the most in both absolute and relative terms, with consumption increasing by 2.4 kg (13 per cent). However, the rate of consumption growth was highest for the extreme poor (i.e., from 1 per cent to 8 per cent), followed by moderate poor and non-poor. Thus, although the non-poor gained most, the accelerating growth in aquaculture output over this period led to increases in fish consumption among all classes of consumer. From this perspective, aquaculture growth over the period 2005–10 can be considered as pro-poor in both "benchmark" and "weak" terms, as it resulted in a definite improvement in the position of poor households in comparison to the first five years of the decade.
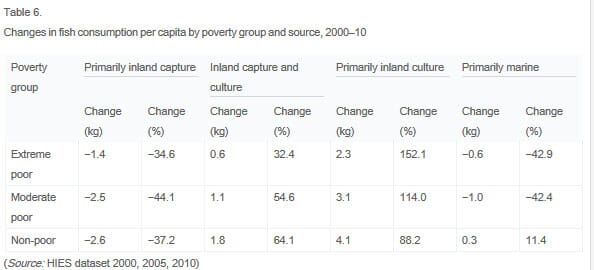
This evaluation only accounts for total fish consumption however. Disaggregating by source (Table 6) reveals that the greatest relative increases in consumption of farmed fish taking place during 2000–10 accrued to the extreme poor, whose average consumption increased by 152 per cent over this period, while consumption among the non-poor increased 88 per cent. Thus, considered alone, aquaculture growth from 2000 to 2010 was pro-poor in "strong, relative" terms.
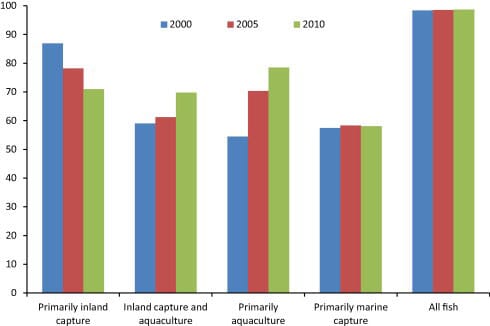
Fish consumption frequency, defined as the percentage of households reporting consumption of fish within the 14-day reference period over which the survey was conducted, follows similar trends to those identified for fish consumption by quantity (Figure 5). A reduction in the frequency of consumption of fish from inland capture fisheries took place from 2000 to 2010 (from 87 per cent to 71 per cent of households), offset by a rapid increase in frequency of consumption of farmed fish (from 54 per cent to 78 per cent). Consumption of all fish (irrespective of origin) remained extremely high across all three years with close to 100 per cent of households in all poverty groups reporting some consumption.
Fish prices
During 2000–05, weighted real prices paid for fish originating from all sources except fish from marine capture fisheries fell or remained constant (Figure 6). The size of relative price changes was similar for all consumers, irrespective of poverty group (Table 7). The real price of farmed fish fell by 9 per cent – more that than of fish from any other source – while the price of inland capture fish fell 2 per cent, despite a contraction in supply per capita of 19 per cent. This suggests that substitution between farmed and inland capture fish took place, with rapidly expanding supply from aquaculture counteracting upward price pressure on inland capture fish. This finding is consistent that of Tveterås et al. (2012), who identify a similar pattern of interaction in the prices of farmed and wild fish traded in global markets. This effect was not apparent for primarily marine fish, the price of which increased by 12 per cent, against a decrease in supply per capita of just 1 per cent. This group is dominated by Bangladesh’s most highly prized, culturally significant and expensive fish, hilsa, which accounted for approximately half the budget share, and for which no farmed substitute exists.
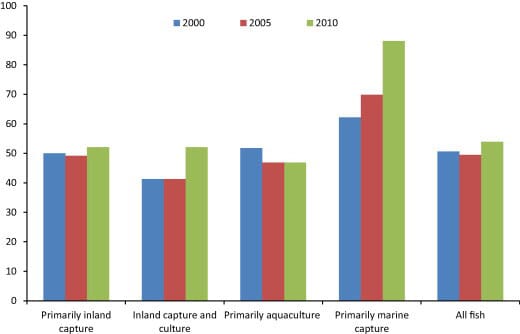
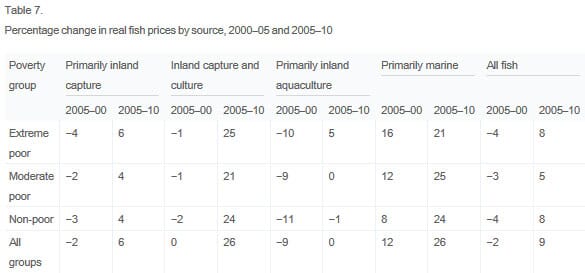
Price trends from 2005 to 2010 were markedly different. Real prices paid for fish from all sources except aquaculture rose significantly for consumers in all poverty groups. Price increases were again high for capture fish of marine origin, which rose 26 per cent on average, despite an increase in per capita supply of 9 per cent. Fish originating from the mixed group "inland capture and aquaculture" also registered a large price increase (26 per cent), against an increase in per capita supply of 12 per cent. Real prices paid for inland capture fish rose 6 per cent, against an 18 per cent reduction in supply. The supply per capita of fish originating primarily from aquaculture grew 54 per cent over this period, but average prices remained static. Much of the contrast between the scenario apparent in the former and latter halves of the decade is likely to be attributable to the enduring effects of the price spike that occurred in 2007–08, which dramatically raised the price of most food commodities.
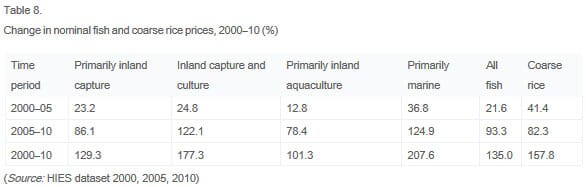
Table 8 places the effects of this event in context, by comparing changes in the nominal price of fish by source with that of the national staple, coarse rice. From 2000 to 2005, increases in the average price of fish were approximately half those of coarse rice, probably reflecting the rapidly expanding supply of fish from aquaculture. This picture changed from 2005 to 2010, during which time average fish prices increased by 13 per cent more than average rice prices. An upward trend in fish prices during this period, relative to those of rice, was also identified by Dey, Spielman, Haque, Rahman, and Valmonte-Santos (2012). Only the price of fish originating primarily from aquaculture increased more slowly than the price of rice. The reasons for these changes are not entirely clear, but it seems possible that increases in the price of marine capture fish (both absolute and relative to the price of rice), and perhaps also of fish in the mixed "inland culture and capture" category, several of which are high value species, reflected demand from an increasingly wealthy population post-2005, which expanded faster than moderate increases in per capita supply.
The role of aquaculture growth in keeping average fish price inflation fairly close to that of rice during this period is particularly significant. Had this growth not occurred, it is probable that prices of inland capture fish would have risen to much higher levels, with serious implications for consumption, particularly among the extreme and moderate poor who depend upon them most. It is also notable that the increase in the average price of fish was not large enough to reduce total consumption among any group, suggesting that the growth in real wages occurring at this time was sufficient to offset fish price inflation.
Discussion and conclusions: was aquaculture growth pro-poor?
Summary
This paper has sought to broaden the debate on the contribution of aquaculture to poverty alleviation. This has been achieved by; (1) advancing a theoretically grounded definition of pro-poor aquaculture growth with respect to the indirect food consumption linkages conceptualized in the aquaculture and poverty literature, and; (2) analyzing a robust, nationally representative time series dataset on fish consumption in Bangladesh over the period 2000–10, including the disaggregation of results according to poverty categories based on national poverty lines. This analysis was located within the context of wider changes occurring in the national economy, which have a crucial explanatory bearing on the results derived. The approach adopted represents an advance on many earlier studies which investigated the relationship between aquaculture and poverty reduction in a less systematic manner, using smaller and less representative datasets. By broadening the scope of enquiry beyond local contexts (e.g., specific project interventions or types of aquaculture) and short time horizons, this study has sought to achieve greater explanatory power. This effort is important because it helps to clarify some of the poverty and food security implications of the global structural transition in fish supply from capture fisheries to aquaculture, and refines debate around the circumstances under which aquaculture may result in pro-poor outcomes.
To recap, a number of key changes occurred during 2000–10. Economic growth during this period was slightly pro-poor overall, but strongly pro-poor, and pro-rural, during the latter half of the decade, partly due to large increases in real rural incomes. This resulted in rapid poverty reduction throughout the entire period and lessening inequality during its second half. Fish consumption per capita grew sharply over this period – an average increase of 28.6 per cent at the national level. This can be inferred to have resulted almost entirely from increasing aquaculture production, as the contribution of inland capture fisheries to total fish consumption fell by 47.6 per cent, while that of aquaculture grew by 75 per cent. Changes in fish consumption frequency also reflect these shifts. As noted in Section 2, the enclosure and conversion of wetland habitat to aquaculture was a contributing factor in the reduced supply of fish from inland capture.
Overall consumption increases were largest in urban areas, but the average rate of consumption growth was highest for rural consumers during the second half of the decade. Fish consumption per capita also increased relatively more quickly for the extreme and moderate poor than for non-poor consumers during this latter period, although by a small absolute amount, but non-poor (and urban) households made larger absolute consumption gains. During the first half of the decade, average real fish prices fell by 2 per cent and the price of farmed fish fell 9 per cent. After 2005, average fish prices increased, in line with global peak food prices. Relative increases in the average price of fish were slightly higher than those for rice at this time. Real prices of fish from aquaculture did not increase during this period however, and substitution of aquaculture fish for those from inland capture fisheries appears to have lessened upward price pressure on the latter.
Was aquaculture growth pro-poor?
Aquaculture’s contribution to growth in total fish consumption was pro-poor in "weak" terms throughout the decade in question, since fish consumption by the extreme and moderate poor increased in absolute terms, but to a lesser degree than consumption by the non-poor. It was also pro-poor in "benchmarked" terms for the second half of the decade, as the rate (and amount) by which fish consumption grew among extreme and moderate poor consumers from 2005 to 2010 was greater than from 2000 to 2005. In the absence of data for the period 1995–2000, it is not possible to determine whether consumption growth from 2000 to 2005 was also benchmark pro-poor.
Total fish consumption is an imperfect indicator of aquaculture’s pro-poor status however, since the apparent decline in inland capture fisheries output per capita that occurred throughout the period partly offset consumption gains from aquaculture. Considered in its own right, aquaculture growth was pro-poor in "strong, relative" terms over the entire period. From 2000 to 2005 consumption of farmed fish by the extreme poor increased 64 per cent, against an increase of 36 per cent for non-poor households, and from 2005 to 2010 consumption grew by 40 per cent and 18 per cent for extreme and non-poor households respectively. Absolute consumption increases were largest for non-poor households, however.
Aquaculture’s contribution to fish consumption was pro-poor because it more than exceeded lost inland capture fisheries production. Ceteris paribus, if aquaculture’s contribution to per capita fish supply had remained constant at 2000 levels, average fish consumption per capita would have fallen by 4.7 kg, or 26 per cent, in 2010. Extreme and moderate poor households would have been most severely affected in both relative and absolute terms, each losing 23 per cent of their consumption (2.3 kg and 3.1 kg respectively), while non-poor households would have experienced an 11 per cent (2.0 kg) drop in fish intakes. Thus, although aquaculture was once considered "unlikely to benefit those with low incomes in Bangladesh" because of a tendency to produce large, high value fish ( Lewis, 1997, p. 533), evidence presented here demonstrates clearly that this is no longer the case. In fact, the expansion of commercial aquaculture has tended to stabilize or reduce the price of fish, which has become relatively more affordable as incomes have risen.
Conversely, the contraction of apparent capture fisheries production negatively impacted the welfare of poor and non-poor consumers alike. It is possible that, had inland capture fisheries output remained constant or declined at a lesser rate, aquaculture growth would have resulted in even more favorable outcomes—perhaps even "strong, relative" pro-poor growth in overall fish consumption. This underlines strong complementarity between the two subsectors in terms of their role in food provisioning for all categories of consumer.
Pro-poor aquaculture growth: wider implications
Four key conclusions can be drawn from the evidence presented above. First, in this particular instance, aquaculture has proven unequivocally pro-poor in terms of the "indirect consumption" pathway conceptualized in Figure 2. Second, this finding must be qualified in the context of wider changes taking place in the national economy during 2000–10. Pro-poor economic growth and a gradual narrowing of the gap between rural and urban areas, particularly during the second half of the decade, appears to have translated very directly into pro-poor and pro-rural fish consumption growth. By the same token, had the growth process over this period resulted in widening economic inequality, it is likely that this would also have manifested in widening inequality in fish consumption. However, although closely linked, pro-poor economic growth processes and the distributional outcomes of aquaculture development are distinct: the nature of aquaculture development itself in terms of its rate of growth, market orientation, mix of commodities produced, capacity to reduce fish prices or maintain them at low levels relative to other food commodities, and the specific nature of its interactions with capture fisheries are all important in determining whether pro-poor outcomes result.
Third, aquaculture growth was driven by the achievement of greater technical efficiencies. This conclusion is consistent with the observation that real prices of farmed fish fell, or remained constant over the entire decade, while increasingly intensive forms of aquaculture commanded progressively larger shares of output. Supply increases which occurred as a result of the commercialization of production exerted downward pressure on relative prices, stimulating greater consumer demand and further efficiencies on the part of producers. Belton and Little, 2008 and Kumar et al., 2005 and Tveterås et al. (2012) have identified similar patterns of aquaculture development in Thailand, India, and at the global level, respectively.
Finally, a sharp decline in apparent capture fisheries output partially undermined the positive effects associated with aquaculture growth. Had it been possible to reduce, or even reverse, the downward trend in capture fisheries output (notwithstanding that this may itself have provided part of the stimulus for aquaculture development), it is likely that overall growth in fish consumption would have been more strongly pro-poor.
These findings lead to two further conclusions. First, with respect to fish consumption, the pro-poor nature of aquaculture growth was contingent on the interplay of two factors: the expansion of fish supply and its effect of dampening fish prices, and the extent to which growth processes in the wider economy reduced inequality. Policies which encourage pro-poor growth may therefore be at least as important in ensuring that aquaculture results in pro-poor outcomes as policies which aim to promote aquaculture itself. A final conclusion is that viable capture fisheries complement pro-poor aquaculture growth from the supply side. The likelihood that the global transition in fisheries will generate pro-poor outcomes will be much greater if actions are taken to sustain the contributions of both sectors, rather than relying on aquaculture alone to meet future demand.
August 2014