Report Highlights
Canada’s commercial catch for all seafish and shellfish in 2005 reached 1,072,288 metric tons (MT) live weight, down 5.1 % from the revised 2004 level of 1,130,260 MT. After two years of successive decline, the total Canadian farmed-raised production of finfish and shellfish was higher during 2005. Total aquaculture production reached 153,995 MT, up more than 6% from the year earlier. For the first time in five years, the value of Canadian imports of U.S. fish and seafood during 2006 registered a year-to-year decline, slipping almost 2% to $665 million from $678 million in 2005.
Executive Summary
THIS REPORT DOES NOT CONTAIN OFFICIAL USDA DATA
- Canada’s commercial catch for all seafish and shellfish in 2005 reached 1,072,288 metric tons (MT) live weight, down 5.1 % from the revised 2004 level of 1,130,260 MT. Most of the decline was attributable to a lower shellfish catch.
- After two years of successive decline, the total Canadian farmed-raised production of finfish and shellfish was higher during 2005. Total aquaculture production reached 153,995 MT, up more than 6% from the year earlier reflecting a moderate increase in total finfish output. Salmon production rose to 98,441 MT, 2% above 96,774 MT a year earlier. Farm-raised shellfish production during 2005 reached 38,195 MT, up 1% from 37,925 MT tons during 2004.
- For the first time in five years, the value of Canadian imports of U.S. fish and seafood during 2006 registered a year-to-year decline, slipping almost 2% to $665 million from $678 million in 2005. Despite the decline, Canada remained the No. 3 export market for U.S. fish and seafood exports.
- In 2006, Canadian fish and seafood importers sourced more Asian product than ever before. During that year, the volumes imported from China, Thailand, and Vietnam increased 7%, 9%, and 18% respectively from the year earlier levels.
- Competition from Asian suppliers reduced the U.S. share of the Canadian import market for fish and seafood to 31% in the January to June period of the current year from a recent historical share of about 45%.
- Total Canadian fish and seafood exports in 2006 failed to keep up the record pace established during 2005, slipping 1% to 620,912 MT during 2006 from 626,759 MT in 2005. Canadian sales to the three top export markets over that period, the U.S., China, and Japan were all lower. Much of the decline, a trend that is continuing in the current year, can be partly attributed to the sharp appreciation in the Canadian dollar over the period.
Section I. Production; Commercial Catch
Fisheries and Oceans Canada’s current data availability covers Canada’s total commercial fish and shellfish catch up to 2005. The total Canadian commercial catch for all fish and shellfish species in 2005 reached 1,072,288 MT live weight, down 5.1 % from the revised 2004 level of 1,130,260 MT. Most of the decline was attributable to a lower shellfish catch particularly for scallops, which registered a sharp decline during 2005, but the pelagic and other finfish catches were also lower.
The chart below illustrates how during the last ten years, the Canadian shellfish catch has overtaken each of the groundfish and pelagic fish catches. Despite the fact that the shellfish catch was lower in 2005, the average annual growth rate (AAGR) for the Canadian shellfish catch since 1996 is 4%. This compares to an AAGR of 1.0% for groundfish and 0.4% for pelagic over the same time period.
Section II. Aquaculture
Canadian aquaculture statistics are available up to 2005. The Department of Fisheries and Oceans anticipates the 2006 production totals to be available during the final quarter of calendar year 2007. After two years of successive decline, the total Canadian farmed-raised production of finfish and shellfish was higher during 2005. Total production reached 153,995 MT, up more than 6% from the year earlier reflecting a moderate increase in total finfish output. Salmon output rose to 98,441 MT, 2% above 96,774 MT a year earlier. Farm-raised shellfish production during 2005 reached 38,195 MT, up 1% from 37,925 MT tons during 2004.
Aquaculture Production By Type
Canadian aquaculture production is dominated by the production of farmed-raised salmon, mussels and oysters, which combined, accounted for 87% of total farmed-raised production in 2005. On a regional basis, British Columbia, New Brunswick and Prince Edward Island accounted for 48%, 24%, and 12% respectively of total farmed-raised output.
Section III. Consumption
According to Statistics Canada, total Canadian fish and seafood per capita consumption during 2006 rose fractionally from the year earlier level to 9.36 kg. Despite the small gain, the per capita level in 2006 was 4.5% below the record level set in 2003. The StatCan figures show that per capita shellfish consumption has declined annually over the five year period ending 2006 while the consumption of fresh and frozen seafish and freshwater fish increased.
Section IV. Trade
For the first time in five years, the value of Canadian imports of U.S. fish and seafood during 2006 registered a year-to-year decline, slipping almost 2% to $665 million from $678 million in 2005 (see table, next page). Despite the decline, Canada remained the No. 3 market for U.S. fish and seafood exports. Using trade statistics compiled by the U.S. Bureau of Census, Canada was third after the EU25 and Japan and accounted for 17 % of all U.S. fish and seafood exports valued at $4.0 billion in 2006. Further information about the U.S. seafood trade situation with Canada and the composition of Canadian imports of U.S. fish and seafood is presented elsewhere in this Trade Section.
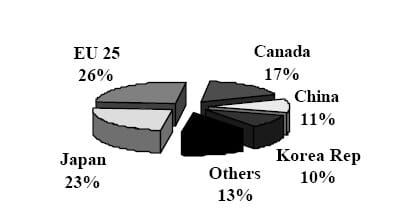
Total U.S. Fish & Seafood Exports In Calneder Year 2006, $4.0 billion.
The Canadian Import Market for Fish & Seafood
Total Imports
On a value basis, spurred partly by increasing demand and by the stronger purchasing power of a rising Canadian dollar, total Canadian imports of fish and seafood climbed a further 8% percent during the first half of 2007 from the record level for that period set one year ago. However, the value of imports from the United States was down during 2006 for the first time in several years and continued to be lower during the first half of 2007. As shown in the table below, competition from China and other countries increased sharply and reduced the U.S. share of the Canadian import market for fish and seafood to 31% in the January to June period of the current year from a recent historical share of about 45%. For more information on Canadian fish and seafood imports from China, see last year’s report CA6047 and the section entitled China Emerges as a Major Supplier in the Canadian Seafood Market.
Total Imports by Quantity
Total Canadian imports of fish and seafood (excluding live) by volume are shown below. The table excludes imports of live imports for which only value figures are collected. While the size of the Canadian import market for fish and seafood increased during 2006, lower volumes were imported from the United States as Canadian seafood importers turned increasingly to offshore offerings. This development is partly a reflection of a strengthening Canadian dollar and partly an indication that importers in Canada are sourcing more Asian produced species to meet retail demand.
The Composition of Canadian Imports of U.S. Fish & Seafood
On a value basis, Canadian imports of lobster were the leading import of U.S. fish or seafood in 2006, followed by frozen (whole) fish and fish fillets as illustrated on the graph below. However, according to a 2002 study by L.B.C. Consulting Services, commissioned by the Office of Agricultural Affairs, only about 20% of the fresh or frozen whole fish that Canada imports from the United States is re-sold "as is" to retail or foodservice channels. The balance is imported by Canadian processors for further processing, and L.B.C. reports that a significant share is then exported as Canadian product.
Total Exports
Total Canadian fish and seafood exports in 2006 failed to keep the record pace established during 2005, slipping 1% to 620,912 MT during 2006 from 626,759 MT in 2005. Sales to the three top export markets over that period were lower: to the U.S., down 5%, to China, down 2%, and to Japan, down 33%. Much of the decline, a trend that is continuing in the current year, can be attributed to the sharp appreciation in the Canadian dollar over the period. From its level at January 2005 of US$0.816, the Canadian dollar rose 16.7% to US$0.952 by July 2007. In contrast, on a value measure, Canadian fish and seafood exports increased 3.4% to $1.9 billion in the first seven months of 2007 but the fall in volume was 6% as shown on the following table. Note: Since July 2007, the Canadian dollar appreciated further to US$0.990.
Section VI. Marketing
Distribution of Retail Fish and Seafood Sales
According to the 2002 report by L.B.C. Consulting Services of Montreal (contracted by the Office of Agricultural Affairs, see CA2078), the foodservice sector at that time accounted for an estimated 64% of total Canadian retail sales of fish and seafood. While there has been no published update since that time, there is general consensus in the industry that, over the past five years, the foodservice share has advanced to about two-thirds, by value, reflecting the popularity of more Asian and other ethnic meals served in restaurants that contain fish and seafood.
Marketing
Fish and Seafood
Fish and fish products are subject to the Fish Inspection Act and Regulations, which contain requirements for wholesomeness, labeling, packaging, grading, and health and safety. Enforcement is carried out by the Canadian Food Inspection Agency (CFIA). The CFIA also enforces Canada’s Food and Drugs Act and Regulations as they pertain to fish and seafood in the Canadian marketplace.
There is no requirement under current regulations for imported fish products to be accompanied by a health certificate. However, the person who imports fish into Canada must hold a fish import license, must provide written notification to the CFIA for each imported shipment of fish and must make the fish available for inspection. Product inspections are conducted at frequencies that depend on the product's risk and the exporter's history of compliance. The normal inspection frequency for fresh fish such as wild caught salmon from an exporter with a good history of compliance would be 2%. More information regarding the requirements to import fish into Canada can be found on the CFIA web site in the document titled Guide to Canadian Regulatory Requirements and Examination Procedures for Imported Fish. http://www.inspection.gc.ca/english/anima/fispoi/import/importe.shtml
Labeling requirements for packaged fish must include all mandatory information normally found on consumer packages such as:
- country of origin
- common name of the fish;
- name and address of the manufacturer;
- day, month and year of processing; and
- quantity (metric or imperial units)
Information regarding the labeling of fish products is available on the CFIA web site at:
http://www.inspection.gc.ca/english/fssa/labeti/guide/tab15e.shtml
Canadian Importers Database
Industry Canada’s (IC) Importers Database provides U.S. fish and seafood companies a useful tool for identifying major fish and seafood importers in Canada. Electronic searches can be made via HS codes or product descriptions. Listed below is a sample of the database showing the search results for frozen fish fillet importers. The IC web page is:
http://strategis.ic.gc.ca/sc_mrkti/cid/engdoc/index.html
Further Reading
|
|
- You can view the full report, including tables, by clicking here. |
| - To view our complete list of 2007 Fishery Products Annual reports, please click here. |
October 2007