According to the report, Alaska also led all states in value of landings with $1.5 billion, followed by Massachusetts, $417.6 million; Maine, $319.5 million; Louisiana, $259.6 million; and Washington $214.3 million.
Review
U.S. Landings
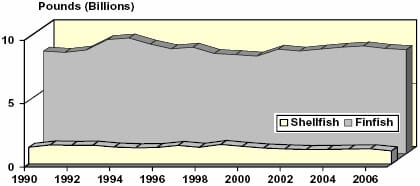
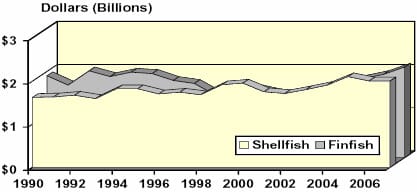
Commercial landings (edible and industrial) by U.S. fishermen at ports in the 50 states were 9.2 billion pounds or 4.2 million metric tons valued at $4.1 billion in 2007— a decrease of 251.2 million pounds (down 3 percent) and an increase of $64.6 million (up 2 percent) compared with 2006. Finfish accounted for 89 percent of the total landings, but only 51 percent of the value. The 2007 average exvessel price paid to fishermen was 44 cents compared to 42 cents in 2006.
Catches of Alaska pollock, Pacific whiting and other Pacific groundfish that are processed at-sea aboard U.S. vessels in the northeastern Pacific are credited as “landings” to the state nearest to the area of capture. Information on landing port or percentage of catch transferred to transport ships for delivery to foreign ports is unavailable.
These at-sea processed fishery products, on a round (live) weight basis, exceeded 1.2 million metric tons in 2007 and comprised more than 30 percent of the total domestic landings in the 50 states.
Commercial landings by U.S. fishermen at ports outside the 50 states along with Internal Water Processing (IWP) agreements (see glossary) provided an additional 158.4 million pounds (71,838 metric tons) valued at $62.5 million. This was an increase of 3 percent, or 4.6 million pounds (2,076 metric tons) in quantity and $1.3 million (2 percent) in value compared with 2006. Most of these landings consisted of tuna, and swordfish landed in American Samoa and other foreign ports.
Edible fish and shellfish landings in the 50 states were 7.5 billion pounds (3.4 million metric tons) in 2007—a decrease of 376,300 thousand pounds (170 metric tons) compared with 2006.
Landings for reduction and other industrial purposes were 1.8 billion pounds (801,149 metric tons) in 2007— a decrease of 2 percent compared with 2006.
The 2007 U.S. marine recreational finfish catch (including fish kept and fish released (discarded)) on the Atlantic, Gulf, and Pacific coasts was an estimated 468.0 million fish taken on an estimated 87.0 million fishing trips. The harvest (fish kept or released dead) was estimated at 196.0 million fish weighing 255.0 million pounds.
World Landing
In 2006, the most recent year for which data are available, world commercial fishery landings and aquaculture production were 143.6 million metric tons—an increase of 0.9 million metric tons compared with 2005.
China was the leading nation with 35.9 percent of the total harvest followed by Peru and India with 4.9 percent. Indonesia was the fourth leading producer with 4.2 percent and the United States was fifth with 3.7 percent.
Prices
The 2007 annual exvessel price index for edible fish increased by 9 percent, shellfish increased 9 percent and industrial increased 60 percent comparing with 2006. Exvessel price indices increased for 21 out of 32 species groups being tracked, decreased for 9 species groups, and unchanged for 2 species groups. The snow crabs price index had the largest increase (71 percent) while bluefin tuna price index showed the largest decrease (23 percent).
Processed Products
The estimated value of the 2007 domestic production of edible and nonedible fishery products was $8.3 billion, $261.7 million less than in 2006. The value of edible products was $7.7 billion—a decrease of $373.4 million compared with 2006. The value of industrial products was $608.4 million in 2007—an increase of $111.7 thousand compared with 2006.
Foreign Trade
The total import value of edible and nonedible fishery products was $28.8 billion in 2007—an increase of $1.1 billion compared with 2006. Imports of edible fishery products (product weight) were 5.3 billion pounds valued at $13.7 billion in 2007—a decrease of 53.8 million pounds but an increase of $340.9 million compared with 2006. Imports of nonedible (i.e., industrial) products were $15.1 billion—an increase of $724.2 million compared with 2006.
Total export value of edible and nonedible fishery products was $20.1 billion in 2007—an increase of $2.3 billion compared with 2006. United States firms exported 2.9 billion pounds of edible products valued at $4.0 billion—a decrease of 97.9 million pounds but an increase of $26.7 million compared with 2006. Exports of nonedible products were valued at $15.8 billion, $2.3 billion more than 2006.
Supply
The U.S. supply of edible fishery products (domestic landings plus imports, round weight equivalent, minus exports) was 12.5 billion pounds in 2007—an increase of 123.6 million pounds compared with 2006. The supply of industrial fishery products was 959.7 million pounds in 2007—an increase of 53.2 million pounds compared with 2006.
Per Capita Consumption
U.S. consumption of fishery products was 16.3 pounds of edible meat per person in 2007, down 0.2 pound from the 2006 per capita consumption of 16.5 pounds.
Consumer Expenditures
U.S. consumers spent an estimated $68.4 billion for fishery products in 2007. The 2007 total includes $45.8 billion in expenditures at food service establishments (restaurants, carry-outs, caterers, etc.); $22.1 billion in retail sales for home consumption; and $474.2 million for industrial fish products. By producing and marketing a variety of fishery products for domestic and foreign markets, the commercial marine fishing industry contributed $34.2 billion (in value added) to the U.S. Gross National Product.
Volume of U. S. Domestic Finfish and Shellfish Landings
1990 - 2007
Value of U.S. Domestic Finfish and Shellfish Landings
1990 - 2007
Further Reading
| - | You can view the full report by clicking here. |
July 2008