The EU confirmed itself as a major seafood consumption market with household expenditures of €54.7 billion in 2013. This marked a 1 per cent increase over 2012 –the highest amount ever recorded.
Apparent consumption per capita for 2012 was 23.9 kg, a 3 per cent decrease from 2011. This downward trend has been seen since 2008, when per capita fish consumption amounted to 26 kg. EU consumers buy less seafood but spend more for it, which indicates a change in consumption preferences as well as fish prices.
EU consumption is dominated by captured fish, which represents three quarters of the total. The most remarkable phenomena observed are the increasing consumption of salmon and herring, and the stabilisation of pangasius.
Demand for organic aquaculture products has grown rapidly over the last years, mostly through imports from outside the EU. The biggest organic markets in the EU are Germany , France, the UK and Italy.
The EU is the largest trader of fishery and aquaculture products in the world in terms of value. EU trade – comprising extra-EU imports and exports, and intra-EU exchanges – has increased steadily over the past five years. In 2014, the trade flow amounted to €45.9 billion and 13.8 million tonnes.
Values of extra-EU imports have been increasing since 2009, at an average annual growth rate of 6 per cent. In 2014, the EU imported fish and seafood for a value of some €21 billion. Extra-EU imports of seafood are more than 4 times higher than meat in value, and this ratio is increasing.
Norway and China remain the main EU suppliers. Imports from Norway, which cover one quarter of the total, reached a peak in 2014, mostly represented by fresh salmon. Norway 's exports to the EU have increased by 70 per cent since 2009. China confirmed its leading role as a processing country for white fish (cod and pollock).
In 2014, EU exports reached €4.3 billion, 30 per cent above the 2006-2014 average. Volumes also were the highest since 2006, reaching more than 2 million tonnes for the first time. While its exports are almost entirely composed of products from captured fisheries, the EU’s aquaculture production is destined for the EU market.
Exchanges between EU Member States represented 86 per cent of the total value of trade within and outside the EU in 2014. All high-value commodities reached peaks in 2014. Overall, volumes sold within the EU totalled 5.74 million tonnes with a value of €20.6 billion – the highest value
registered since 2006.
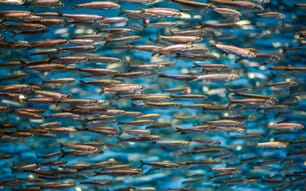
Landings increased 7 per cent in volume in 2013 in the EU, mainly due to sandeels, tuna and sardines. However, the value of EU fishery products landed in 2013 slightly decreased after the recovery started in 2009. Small pelagics registered a decrease of more than €150 million, and their
impact on total EU volumes has been declining since 2009 due to an increase in groundfish landed.
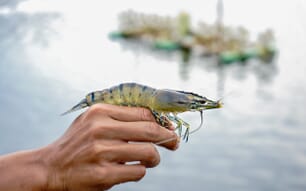
The EU is a net importer of fishery and seafood products, with a trade balance deficit (exports minus imports) that has been growing rapidly since 2009. The 2014 trade deficit was the largest ever at €16.6 billion. This was primarily due to the growing import of shrimps, which increased by
€630 million between 2013 and 2014.
EU self-sufficiency for seafood (production relative to internal consumption) reduced continuously between 2008 and 2011. From 2011 to 2012, it increased from 44 per cent to 44.5 per cent. Flatfish reported a remarkable loss – from 97 per cent to 77 per cent – due to a significant decrease in landings and an increase in imports of frozen products from China.
Retail prices of fish and seafood have grown steadily in the last years, but the growth rate has slowed since 2012. However, fish prices increased faster than meat and food over the period 2009-2014.
Canned tuna continued to be the most important product in terms of apparent consumption in 2012, with its 2 kg per capita. This was a 6 per cent decrease from 2011, reflecting a decline of canned tuna imports in several EU countries, mainly Spain and Italy.